MongoDB Query Profiler & Explain Plan on Mobile
Byson reads a real MongoDB explain plan on mobile - a stage tree, a flame graph, and over-time snapshots that help you find slow MongoDB queries from your phone, on Android and iOS.
Short answer: a MongoDB query profiler on mobile reads explain() output and visualizes where a query spends its time. Byson is a mobile MongoDB client with built-in SSH tunneling and a query profiler for Android and iOS - four tabs built on real explain output show round-trip time, the execution stage tree, a flame graph, and live snapshots. This explain and flame-graph profiling is usually desktop-only; Byson puts it in your pocket.
Can you view a query plan on a phone?
Reading a MongoDB explain() plan has long been a desktop job - you SSH in or open a GUI on a laptop to see why a query is slow. Byson moves that workflow onto the phone. It runs explain against your collection, parses the result, and renders it visually instead of dumping raw JSON, so you can:
- See docs examined versus docs returned and how many indexes a query used.
- Walk the execution plan as a stage tree -
COLLSCAN,IXSCAN,FETCH,SORT. - Spot a collection scan and act on it without leaving your phone.
The four profiler tabs
Byson's query profiler is organized into four tabs, all built on the same real explain output:
| Tab | What it shows |
|---|---|
| Summary | Round-trip time, total execution time, docs examined vs docs returned, and the number of indexes used. |
| Plan | The execution plan as a recursive stage tree (COLLSCAN, IXSCAN, FETCH, SORT) with per-stage times and document flow. |
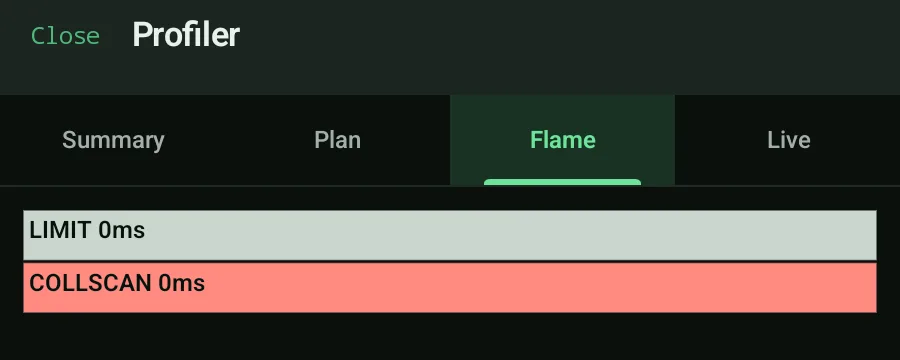
| Flame | A treemap-style flame graph of stage time, color-coded by stage type - red = COLLSCAN, green = IXSCAN/FETCH, yellow = SORT, gray = other. |
| Live | Snapshots of the same query over time (timestamp, duration, docs examined/returned, indexes used) to spot regressions. |
Reading the MongoDB flame graph
The Flame tab is a treemap-style flame graph where each block is sized by how much time a stage took and colored by stage type. A wide red block means a COLLSCAN is dominating the query; green IXSCAN/FETCH blocks mean the query is using indexes; yellow flags an in-memory SORT. It turns a wall of explain JSON into a picture you can read in a second on a small screen.
Find slow MongoDB queries in three steps
- Run a find or aggregate in Byson, then open the profiler on the result.
- Check Summary for a high docs-examined-to-returned ratio, then open Plan and Flame to find the expensive stage.
- If Byson detects a
COLLSCAN, tap Suggest index - it opens the index create form prefilled so you can fix the slow query.
Official reference: MongoDB - Analyze Query Performance.
A MongoDB query profiler that fits in your pocket
Byson is a mobile MongoDB client with built-in SSH tunneling - free on Google Play and the App Store. The BYO AI Copilot is an optional bonus. Explain plans, a stage tree, a flame graph, and live snapshots built in.
FAQ
Can I see a MongoDB explain plan on mobile?
Yes. Byson is a mobile MongoDB client with built-in SSH tunneling whose query profiler runs real explain() output and renders the execution plan as a stage tree - COLLSCAN, IXSCAN, FETCH, and SORT - with per-stage times and document flow, so you can read a MongoDB explain plan on Android and iOS.
What is the flame graph in Byson's query profiler?
The Flame tab shows a treemap-style flame graph of stage time, color-coded by stage type: red for COLLSCAN, green for IXSCAN and FETCH, yellow for SORT, and gray for other stages. It makes the most expensive part of a slow MongoDB query obvious at a glance from your phone.
How do I find slow MongoDB queries from my phone?
Run the query in Byson and open the profiler. The Summary tab shows round-trip time, execution time, and docs examined versus returned, while the Plan and Flame tabs expose collection scans. Byson detects COLLSCAN and surfaces a Suggest index action to fix the slow query.
Guide: fix a MongoDB COLLSCAN and suggest an index →
Also: the best mobile MongoDB GUI →